Software as a Service (SaaS)

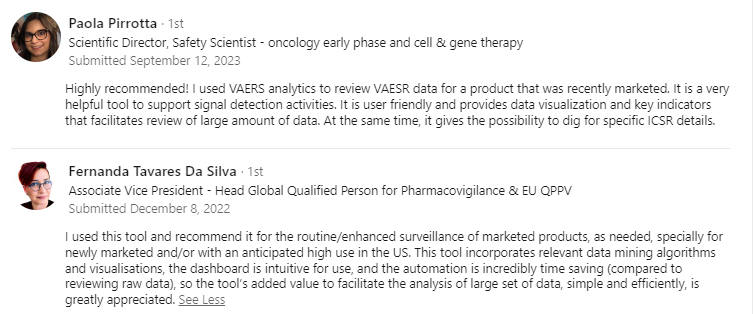
VAERS Analytics and FAERS Analytics each consist in three modules:
A data management module performing the following tasks:
- data extraction,
- data cleaning,
- insight generation: new cases from last import, co-administrations, reconciliation with corporate cases, etc.
- de-duplication on demand
A signal detection module performing the following tasks:
- generation of the disproportionality scores
- flag the unexpected TTO distributions
- flag the temporal clusters
A shiny app that allows users to quickly investigate the product-event pairs flagged as quantitative signals by looking at the data either at the case series level leveraging visualizations or at the case level with the narratives. In case, a series of actions has to be performed routinely, reports can be automatically generated using Rmarkdown so that users can focus on the interpretation instead of wasting time collating data and visualizations.
VAERS Analytics and FAERS Analytics can be customized at will for a given product as it is deployed independently from the other products. Meaning that the cleaning can be customized based on the product knowledge (eg batch nomenclature, case reconciliation, incorrect dates), the signal detection can be adapted (choice of stratification, different methodology) and the visualizations can also be adapted to focus on areas of concerns (eg. medication errors in the early years of a vaccine release).

The StandAlone Signal Detection SaaS allows users to upload a minimalist report from their own spontaneous report database so that they can get insight from what are the disproportionality scores for their own products. It can help them assessing what would be the performance associated with different disproportionality analysis methods or with time-to-onset signal detection without requesting complex IT project or advanced analytical skills.
Please reach out to us should you want more details or would like a demo: info@opensourcepv.com